Big Poppa Code Strat & Momentum Strategy IndicatorThis indicator is a combination of a few things in order to work with a unique trading style gleaned from Callme100k, jrgreatness, TrustMyLevels , FaithInTheStrat, Rob Smith and Saty Mahajan.
This Indicator is created to help you day trade using, ATR Fibonacci Levels, Price Action and Momentum.
It displays Fibonacci Levels Based on ATR to indicate when a security is 0.236, 0.382 +- the Days Open, +- the Days Open, 0.618 +- the Days Open and 1.0 +- Days Open.
To understand this script you need to understand
Average True Range (ATR)
1 Bar Inside Bar
2 Bar Outside Bar (Break either the top or bottom)
3 Bar Engulfing Bar
Strat Setups - 212, 322, 312
Fibonacci - 0.236, 0.382, 0.618, 1.0
Moving Averages
A Trend is considered bullish when (green)
Current Price is greater than the Fast EMA Value (8)
Fast EMA is greater than PIVOT EMA Value (21)
Pivot EMA is greater than SLOW EMA Value (34)
OR Hull is trending up and the Price is above the Volume Weighted Moving Average and price is above VWAP
A trend is considered Bearish when (red)
Current Price is less than the Fast EMA Value (8)
Fast EMA is less than PIVOT EMA Value (21)
Pivot EMA is less than SLOW EMA Value (34)
OR Hull is trending down and the Price is below the Volume Weighted Moving Average and price is below VWAP
If these conditions are not met then the Momentum is in Conflict (orange)
The Momentum band will match the color of the current trend
The table that is present can be turned off at any time lets you see
1) If Moving Averages are showing bullish, bearish or in conflict
2) If There us Time Frame Continuity, (if 5 min up, are all the other timeframes up also)
3) How much of the ATR have we moved on the day
4) Are we in Call or Put range for the day based on ATR Fib Levels
The Ideal situation for entering a call
1) Momentum is Green
2) FTFC on Green
3) A Strat Actionable Signal is present
4) You are in the call range, 0.236 - 0.618 ATR + the Price
5) The ATR still has room, I.e only 50% of the ATR has been run already
Ideal situation from entering a put
1) Momentum is red
2) FTFC on Red
3) A Strat Actionable Signal is present
4) You are in the put range, 0.236 - 0.618 ATR - the Price
5) The ATR still has room, I.e only 50% of the ATR has been run already
Exit the trade for these reasons you entered (for profit or loss)
1) ATR has no more room
2) FTFC is now in conflict
3) Momentum has shifted
Take Profit when
1) You reach a new ATR Level 0.618, 1.0 , -0.618, -1, etc
Passive Stop Loss
1) Open Price if you are aggressive
2) Next ATR Level Down or Up
Feel free to take profit and leave runners
This script does not give signals, you should do your own research, I am not a financial advisors, I am simply applying principles of seasoned veterans to code. You make all decisions about how you buy, sell and trade. The creator of this script makes no promises and takes no responsibility for your personal trading.
To research the methods described above look up
Rob Smith : The Strat
Saty Mahajan : ATR Levels
Fibonacci
Using the HULL Moving Average
Exponential Moving Averages
VWAP
VWMA
חפש סקריפטים עבור "Exponential Moving Average"

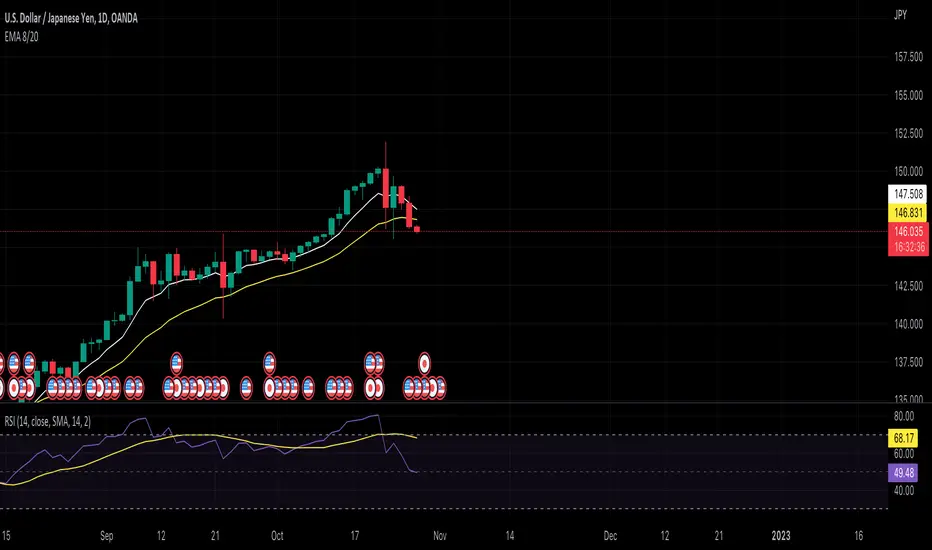
EMA 8/20Overlay the 8- and 20-period exponential moving averages.
Also known as an exponentially weighted moving average, the EMA gives more significance to recent periods compared to an SMA (simple moving average).
Learn more about the EMA on Investopedia
Simple Moving Averge StrategySimple Vs. Exponential Moving Averages
Formula for Exponential Moving Average (EMA)
\begin{aligned} &\begin{aligned} EMA_{\text{Today}}=&\left(\text{Value}_{\text{Today}}\ast\left(\frac{\text{Smoothing}}{1+\text{Days}}\right)\right)\\ &+EMA_{\text{Yesterday}}\ast\left(1-\left(\frac{\text{Smoothing}}{1+\text{Days}}\right)\right)\end{aligned}\\ &\textbf{where:}\\ &EMA=\text{Exponential moving average} \end{aligned}
EMA
Today
=
(Value
Today
∗(
1+Days
Smoothing
))
+EMA
Yesterday
∗(1−(
1+Days
Smoothing
))
where:
EMA=Exponential moving average
While there are many possible choices for the smoothing factor, the most common choice is:

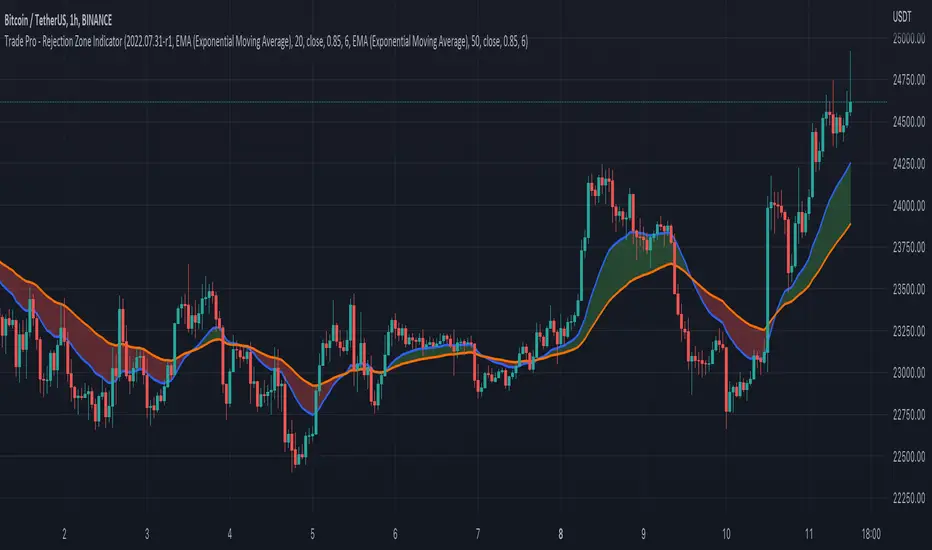
Trade Pro - Rejection Zone IndicatorThe Rejection Zone Indicator can be used to help trend following traders know when to buy dips in up trends, and when to sell pull backs in down trends.
The Rejection Zone Indicator is made up of the 20 and 50 period Exponential Moving Averages. This indicator has colored shading in between these two EMAs, which acts as a nice visual. When the 20 period Exponential Moving Average is below the 50 period Exponential Moving Average, the shaded cloud will be red, and when the 20 EMA is over the 50 EMA the cloud will be green. It is called the Rejection Zone indicator, because often in trends when price pulls back to the colored cloud, it will act as an area of support or resistance.
The suggested use of the Rejection Zone Indicator is to look for long trades when the cloud is green, and once price has pulled back into the green cloud. If the cloud is red one can look for short trading opportunity when price pulls back into the red cloud.
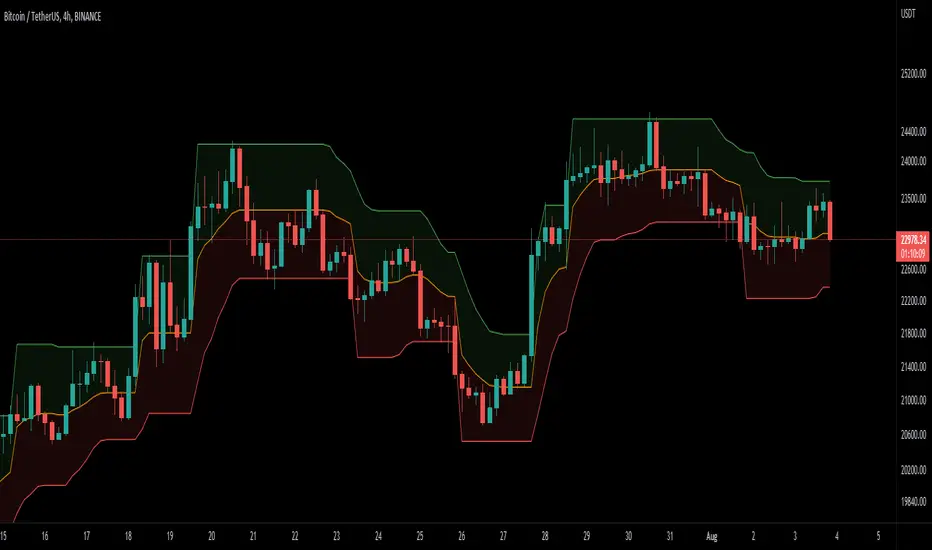
Swing Trend StrategyThis script is a trend following system which uses a long term Moving Average to spot the trend in combination with the Average True Range to filter out Fakeouts, limiting the overall drawdown.
Default Settings and Calculation:
- The trend is detected using the Exponential Moving Average on 200 periods.
- The Average True Range is calculated on 10 periods.
- The Market is considered in an Uptrend when the price closes above the EMA + ATR.
- The Market is considered in a Downtrend when the price closes below the EMA - ATR.
- The strategy will open a LONG position when the market is in an Uptrend.
- The strategy will close its LONG positions when the price closes below the EMA.
- The strategy will open a SHORT position when the market is in a Downtrend.
- The strategy will close its SHORT positions when the price closes above the EMA.
This script is best suited for the 4h timeframe, and shows good results on BTC and ETH especially.
The options allow to modify the type of moving average to use, the period of the moving average, the ATR multiplier to add as well as the possibility to open short trades or not.

DEMA Supertrend Bands [Misu]█ Indicator based on DEMA (Double Exponential Moving Average) & Supertrend to show Bands .
DEMA attempts to remove the inherent lag associated with Moving Averages by placing more weight on recent values.
Supertrend aims to detect price trends, it's also used to set protective stops.
█ Usages:
Combining Dema to calculate Supertrend results in nice lower and upper bands.
This can be used to identify potential supports and resistances and set protective stops.
█ Parameters:
Length DEMA: Double Ema lenght used to calculate DEMA. Dema is used by Supertrend indicator.
Length Atr: Atr lenght used to calculate Atr. Atr is used by Supertrend indicator.
Band Mult: Used to calculate Supertrend Bands width.
█ Other Applications:
The mid band can be used to filter bad signals in the manner of a more classical Moving Average.
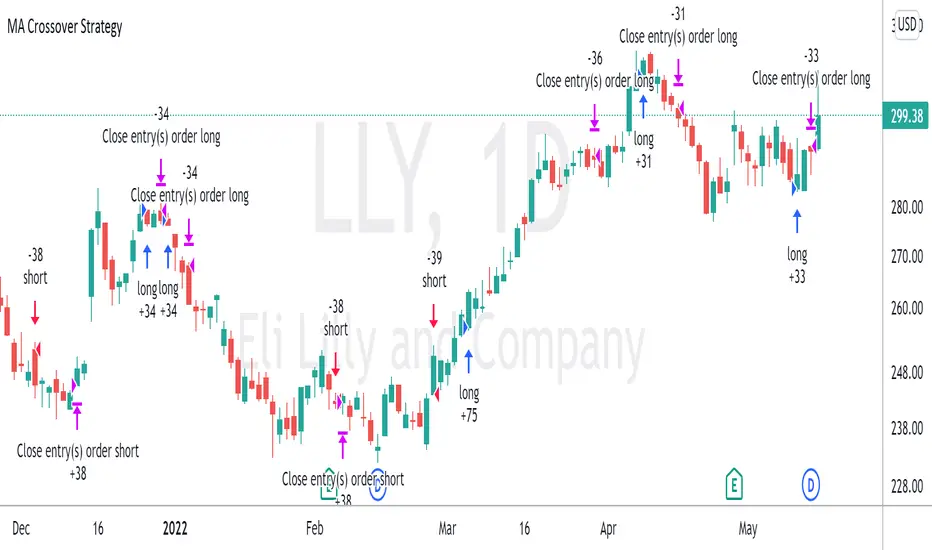
Moving Average Crossover StrategyThe Moving Average Crossover indicator uses 3 moving averages (2 simple moving averages and 1 exponential moving average ) to signal long and short opportunities based on moving average crossovers. This strategy serves as a backtest to that indicator. By taking entry and exit positions based on moving average crossovers, we are able to project profit with this script. You are given the option to select which moving average crossings trigger entry and exit signals. Fast refers to an EMA which should be your shortest MA. Slow refers to the first SMA which will serve as a signal line. Trend refers to a long SMA which will help determine if you should take long positions or short. You can also filter by extra conditions such as minimum volume or RSI. For example, you may have the script trigger a buy signal if the 5ema crosses the 20 sma while RSI reads 60 and sell if it crosses again.
This strategy starts with $100,000 and uses 10% of the account per trade.
Triple ThreatThis indicator provides buy and sell signals for Bitcoin based on confluence from well-known momentum, volatility, and trend indicators. It has successfully captured the major directional trends on Bitcoin's daily chart since 2018, and the settings are currently optimized for this chart in particular. This indicator implements RSI to gauge momentum, BBWP to gauge volatility, and an EMA to gauge trend. Maximum confluence signals are represented by horizontal bars in the indicator's pane, where the tallest green bar is a confirmed buy signal, and the tallest red bar is a confirmed sell signal. The shortest bar represents a momentum-only signal, and the second-shortest bar represents a volatility signal in confluence with the previously given momentum signal.
To track momentum, the RSI is plotted to the indicator plane against a moving average of the RSI. A momentum signal is generated when the RSI crosses over its moving average, retests/approaches the moving average, and then continues in the crossover direction (i.e., it fails to cross the moving average to the opposite side, creating a successful retest). The settings that affect this trigger are the "Crossover Threshold," which specifies how much the RSI should exceed the moving average to be considered a crossover, and the "Retest threshold," which specifies how closely the RSI should approach the moving average to be considered a retest. A momentum signal is ALSO generated if the RSI or its moving average exceed their counterpart by a certain threshold. For example, if the threshold was set at 10, a BUY signal would be generated when the RSI exceeds the moving average by 10, or a SELL signal would be generated when the moving average exceeds the RSI by 10. This threshold can be set using the "Instant Signal Threshold" setting. Either type of momentum signal will be plotted on the pane as the shortest horizontal bar, with its color indicating the signal's direction.
Volatility is primarily measured using the Bollinger Band Width Percentile (BBWP) indicator, which was created by The_Caretaker. BBWP plots the volatility of the asset's price, given by Bollinger Band width, relative to past volatility by assigning the volatility readings into percentiles. The indicator also includes a moving average of the BBWP itself, where a crossover to the upside represents expanding volatility and a crossover to the downside represents contracting volatility. This indicator is used to confirm a signal given by the momentum indicators - a momentum signal that is given during a period of expanding volatility has a greater likelihood of success. Therefore, when the BBWP crosses above its moving average by a given threshold, a previously triggered momentum signal is considered to be "confirmed." The threshold for this crossover can be set using the "BBWP Confirmation Threshold" setting. However, it is also relevant that periods of extreme volatility often accompany an extremity in price action (a "top" or "bottom"), in which case the BBWP is likely to contract after price reaches such an extremity. This phenomenon is captured by also using "extreme reads" on the momentum indicator to signal that there has already been enough volatility to confirm a momentum signal. If the RSI gives an "extreme read" before triggering a signal, the momentum signal is also considered to be confirmed. For example, if the RSI is above 80, breaks below 80, and then gives a SELL signal, this sell signal is considered to be confirmed without requiring the BBWP to crossover its moving average to the upside. The threshold that would confirm a SELL signal can be set with the "Overbought" setting, and the threshold that would confirm a BUY signal can be set with the "Oversold" setting. Whenever a volatility signal confirms a momentum signal, a medium-sized horizontal bar will be plotted on the pane in the same directional color as the momentum signal. Note that a momentum signal may trigger at the exact same time as the volatility signal which confirms it; in this case, only the medium-sized bar will be visible on the pane, but its direction can still be identified by its color.
Lastly, to reduce the likelihood of "false signals," a trend indicator is used to confirm the direction of the signal. This is typically an exponential moving average. If a confirmed volatility SELL signal is given, and the closing price is below the moving average, then the SELL signal is also confirmed by the trend. Likewise, if a confirmed volatility BUY signal is given, and the closing price is above the moving average, then the BUY signal is confirmed by the trend. The type and length of the moving average used to verify the trend can be set using the "Moving Average Type" and "Moving Average Length" settings found below the momentum/volatility settings. A trend signal is plotted on the pane as a tall horizontal bar, and is more deeply colored than the momentum and volatility signals.
For maximum confluence, it is recommended that the trend signal, given by the tallest bar, is the one that forms the basis of trades executed while using the Triple Threat indicator. It is possible to enter more aggressive trades with better entries by using only the volatility signal, given by the medium-sized bar, however this entails greater risk and should only be done in confluence with an additional trading strategy of your own discretion. Backtesting has shown that using the volatility signal alone underperforms using the volatility signal in confluence with the trend signal.
Please also be advised that the default setting are optimized for Bitcoin's daily chart only. The indicator is still applicable to other timeframes and asset classes, but the settings may need to be modified. I have a list of settings for other Bitcoin timeframes, and I would be happy to share them upon request.
I hope you can find this indicator to be of some use to your trading strategies. I'd be happy to hear any feedback from the community, so please don't hesitate to reach out. Stay safe, and happy trading.

taLibrary "ta"
█ OVERVIEW
This library holds technical analysis functions calculating values for which no Pine built-in exists.
Look first. Then leap.
█ FUNCTIONS
cagr(entryTime, entryPrice, exitTime, exitPrice)
It calculates the "Compound Annual Growth Rate" between two points in time. The CAGR is a notional, annualized growth rate that assumes all profits are reinvested. It only takes into account the prices of the two end points — not drawdowns, so it does not calculate risk. It can be used as a yardstick to compare the performance of two instruments. Because it annualizes values, the function requires a minimum of one day between the two end points (annualizing returns over smaller periods of times doesn't produce very meaningful figures).
Parameters:
entryTime : The starting timestamp.
entryPrice : The starting point's price.
exitTime : The ending timestamp.
exitPrice : The ending point's price.
Returns: CAGR in % (50 is 50%). Returns `na` if there is not >=1D between `entryTime` and `exitTime`, or until the two time points have not been reached by the script.
█ v2, Mar. 8, 2022
Added functions `allTimeHigh()` and `allTimeLow()` to find the highest or lowest value of a source from the first historical bar to the current bar. These functions will not look ahead; they will only return new highs/lows on the bar where they occur.
allTimeHigh(src)
Tracks the highest value of `src` from the first historical bar to the current bar.
Parameters:
src : (series int/float) Series to track. Optional. The default is `high`.
Returns: (float) The highest value tracked.
allTimeLow(src)
Tracks the lowest value of `src` from the first historical bar to the current bar.
Parameters:
src : (series int/float) Series to track. Optional. The default is `low`.
Returns: (float) The lowest value tracked.
█ v3, Sept. 27, 2022
This version includes the following new functions:
aroon(length)
Calculates the values of the Aroon indicator.
Parameters:
length (simple int) : (simple int) Number of bars (length).
Returns: ( [float, float ]) A tuple of the Aroon-Up and Aroon-Down values.
coppock(source, longLength, shortLength, smoothLength)
Calculates the value of the Coppock Curve indicator.
Parameters:
source (float) : (series int/float) Series of values to process.
longLength (simple int) : (simple int) Number of bars for the fast ROC value (length).
shortLength (simple int) : (simple int) Number of bars for the slow ROC value (length).
smoothLength (simple int) : (simple int) Number of bars for the weigted moving average value (length).
Returns: (float) The oscillator value.
dema(source, length)
Calculates the value of the Double Exponential Moving Average (DEMA).
Parameters:
source (float) : (series int/float) Series of values to process.
length (simple int) : (simple int) Length for the smoothing parameter calculation.
Returns: (float) The double exponentially weighted moving average of the `source`.
dema2(src, length)
An alternate Double Exponential Moving Average (Dema) function to `dema()`, which allows a "series float" length argument.
Parameters:
src : (series int/float) Series of values to process.
length : (series int/float) Length for the smoothing parameter calculation.
Returns: (float) The double exponentially weighted moving average of the `src`.
dm(length)
Calculates the value of the "Demarker" indicator.
Parameters:
length (simple int) : (simple int) Number of bars (length).
Returns: (float) The oscillator value.
donchian(length)
Calculates the values of a Donchian Channel using `high` and `low` over a given `length`.
Parameters:
length (int) : (series int) Number of bars (length).
Returns: ( [float, float, float ]) A tuple containing the channel high, low, and median, respectively.
ema2(src, length)
An alternate ema function to the `ta.ema()` built-in, which allows a "series float" length argument.
Parameters:
src : (series int/float) Series of values to process.
length : (series int/float) Number of bars (length).
Returns: (float) The exponentially weighted moving average of the `src`.
eom(length, div)
Calculates the value of the Ease of Movement indicator.
Parameters:
length (simple int) : (simple int) Number of bars (length).
div (simple int) : (simple int) Divisor used for normalzing values. Optional. The default is 10000.
Returns: (float) The oscillator value.
frama(source, length)
The Fractal Adaptive Moving Average (FRAMA), developed by John Ehlers, is an adaptive moving average that dynamically adjusts its lookback period based on fractal geometry.
Parameters:
source (float) : (series int/float) Series of values to process.
length (int) : (series int) Number of bars (length).
Returns: (float) The fractal adaptive moving average of the `source`.
ft(source, length)
Calculates the value of the Fisher Transform indicator.
Parameters:
source (float) : (series int/float) Series of values to process.
length (simple int) : (simple int) Number of bars (length).
Returns: (float) The oscillator value.
ht(source)
Calculates the value of the Hilbert Transform indicator.
Parameters:
source (float) : (series int/float) Series of values to process.
Returns: (float) The oscillator value.
ichimoku(conLength, baseLength, senkouLength)
Calculates values of the Ichimoku Cloud indicator, including tenkan, kijun, senkouSpan1, senkouSpan2, and chikou. NOTE: offsets forward or backward can be done using the `offset` argument in `plot()`.
Parameters:
conLength (int) : (series int) Length for the Conversion Line (Tenkan). The default is 9 periods, which returns the mid-point of the 9 period Donchian Channel.
baseLength (int) : (series int) Length for the Base Line (Kijun-sen). The default is 26 periods, which returns the mid-point of the 26 period Donchian Channel.
senkouLength (int) : (series int) Length for the Senkou Span 2 (Leading Span B). The default is 52 periods, which returns the mid-point of the 52 period Donchian Channel.
Returns: ( [float, float, float, float, float ]) A tuple of the Tenkan, Kijun, Senkou Span 1, Senkou Span 2, and Chikou Span values. NOTE: by default, the senkouSpan1 and senkouSpan2 should be plotted 26 periods in the future, and the Chikou Span plotted 26 days in the past.
ift(source)
Calculates the value of the Inverse Fisher Transform indicator.
Parameters:
source (float) : (series int/float) Series of values to process.
Returns: (float) The oscillator value.
kvo(fastLen, slowLen, trigLen)
Calculates the values of the Klinger Volume Oscillator.
Parameters:
fastLen (simple int) : (simple int) Length for the fast moving average smoothing parameter calculation.
slowLen (simple int) : (simple int) Length for the slow moving average smoothing parameter calculation.
trigLen (simple int) : (simple int) Length for the trigger moving average smoothing parameter calculation.
Returns: ( [float, float ]) A tuple of the KVO value, and the trigger value.
pzo(length)
Calculates the value of the Price Zone Oscillator.
Parameters:
length (simple int) : (simple int) Length for the smoothing parameter calculation.
Returns: (float) The oscillator value.
rms(source, length)
Calculates the Root Mean Square of the `source` over the `length`.
Parameters:
source (float) : (series int/float) Series of values to process.
length (int) : (series int) Number of bars (length).
Returns: (float) The RMS value.
rwi(length)
Calculates the values of the Random Walk Index.
Parameters:
length (simple int) : (simple int) Lookback and ATR smoothing parameter length.
Returns: ( [float, float ]) A tuple of the `rwiHigh` and `rwiLow` values.
stc(source, fast, slow, cycle, d1, d2)
Calculates the value of the Schaff Trend Cycle indicator.
Parameters:
source (float) : (series int/float) Series of values to process.
fast (simple int) : (simple int) Length for the MACD fast smoothing parameter calculation.
slow (simple int) : (simple int) Length for the MACD slow smoothing parameter calculation.
cycle (simple int) : (simple int) Number of bars for the Stochastic values (length).
d1 (simple int) : (simple int) Length for the initial %D smoothing parameter calculation.
d2 (simple int) : (simple int) Length for the final %D smoothing parameter calculation.
Returns: (float) The oscillator value.
stochFull(periodK, smoothK, periodD)
Calculates the %K and %D values of the Full Stochastic indicator.
Parameters:
periodK (simple int) : (simple int) Number of bars for Stochastic calculation. (length).
smoothK (simple int) : (simple int) Number of bars for smoothing of the %K value (length).
periodD (simple int) : (simple int) Number of bars for smoothing of the %D value (length).
Returns: ( [float, float ]) A tuple of the slow %K and the %D moving average values.
stochRsi(lengthRsi, periodK, smoothK, periodD, source)
Calculates the %K and %D values of the Stochastic RSI indicator.
Parameters:
lengthRsi (simple int) : (simple int) Length for the RSI smoothing parameter calculation.
periodK (simple int) : (simple int) Number of bars for Stochastic calculation. (length).
smoothK (simple int) : (simple int) Number of bars for smoothing of the %K value (length).
periodD (simple int) : (simple int) Number of bars for smoothing of the %D value (length).
source (float) : (series int/float) Series of values to process. Optional. The default is `close`.
Returns: ( [float, float ]) A tuple of the slow %K and the %D moving average values.
supertrend(factor, atrLength, wicks)
Calculates the values of the SuperTrend indicator with the ability to take candle wicks into account, rather than only the closing price.
Parameters:
factor (float) : (series int/float) Multiplier for the ATR value.
atrLength (simple int) : (simple int) Length for the ATR smoothing parameter calculation.
wicks (simple bool) : (simple bool) Condition to determine whether to take candle wicks into account when reversing trend, or to use the close price. Optional. Default is false.
Returns: ( [float, int ]) A tuple of the superTrend value and trend direction.
szo(source, length)
Calculates the value of the Sentiment Zone Oscillator.
Parameters:
source (float) : (series int/float) Series of values to process.
length (simple int) : (simple int) Length for the smoothing parameter calculation.
Returns: (float) The oscillator value.
t3(source, length, vf)
Calculates the value of the Tilson Moving Average (T3).
Parameters:
source (float) : (series int/float) Series of values to process.
length (simple int) : (simple int) Length for the smoothing parameter calculation.
vf (simple float) : (simple float) Volume factor. Affects the responsiveness.
Returns: (float) The Tilson moving average of the `source`.
t3Alt(source, length, vf)
An alternate Tilson Moving Average (T3) function to `t3()`, which allows a "series float" `length` argument.
Parameters:
source (float) : (series int/float) Series of values to process.
length (float) : (series int/float) Length for the smoothing parameter calculation.
vf (simple float) : (simple float) Volume factor. Affects the responsiveness.
Returns: (float) The Tilson moving average of the `source`.
tema(source, length)
Calculates the value of the Triple Exponential Moving Average (TEMA).
Parameters:
source (float) : (series int/float) Series of values to process.
length (simple int) : (simple int) Length for the smoothing parameter calculation.
Returns: (float) The triple exponentially weighted moving average of the `source`.
tema2(source, length)
An alternate Triple Exponential Moving Average (TEMA) function to `tema()`, which allows a "series float" `length` argument.
Parameters:
source (float) : (series int/float) Series of values to process.
length (float) : (series int/float) Length for the smoothing parameter calculation.
Returns: (float) The triple exponentially weighted moving average of the `source`.
trima(source, length)
Calculates the value of the Triangular Moving Average (TRIMA).
Parameters:
source (float) : (series int/float) Series of values to process.
length (int) : (series int) Number of bars (length).
Returns: (float) The triangular moving average of the `source`.
trima2(src, length)
An alternate Triangular Moving Average (TRIMA) function to `trima()`, which allows a "series int" length argument.
Parameters:
src : (series int/float) Series of values to process.
length : (series int) Number of bars (length).
Returns: (float) The triangular moving average of the `src`.
trix(source, length, signalLength, exponential)
Calculates the values of the TRIX indicator.
Parameters:
source (float) : (series int/float) Series of values to process.
length (simple int) : (simple int) Length for the smoothing parameter calculation.
signalLength (simple int) : (simple int) Length for smoothing the signal line.
exponential (simple bool) : (simple bool) Condition to determine whether exponential or simple smoothing is used. Optional. The default is `true` (exponential smoothing).
Returns: ( [float, float, float ]) A tuple of the TRIX value, the signal value, and the histogram.
uo(fastLen, midLen, slowLen)
Calculates the value of the Ultimate Oscillator.
Parameters:
fastLen (simple int) : (series int) Number of bars for the fast smoothing average (length).
midLen (simple int) : (series int) Number of bars for the middle smoothing average (length).
slowLen (simple int) : (series int) Number of bars for the slow smoothing average (length).
Returns: (float) The oscillator value.
vhf(source, length)
Calculates the value of the Vertical Horizontal Filter.
Parameters:
source (float) : (series int/float) Series of values to process.
length (simple int) : (simple int) Number of bars (length).
Returns: (float) The oscillator value.
vi(length)
Calculates the values of the Vortex Indicator.
Parameters:
length (simple int) : (simple int) Number of bars (length).
Returns: ( [float, float ]) A tuple of the viPlus and viMinus values.
vzo(length)
Calculates the value of the Volume Zone Oscillator.
Parameters:
length (simple int) : (simple int) Length for the smoothing parameter calculation.
Returns: (float) The oscillator value.
williamsFractal(period)
Detects Williams Fractals.
Parameters:
period (int) : (series int) Number of bars (length).
Returns: ( [bool, bool ]) A tuple of an up fractal and down fractal. Variables are true when detected.
wpo(length)
Calculates the value of the Wave Period Oscillator.
Parameters:
length (simple int) : (simple int) Length for the smoothing parameter calculation.
Returns: (float) The oscillator value.
█ v7, Nov. 2, 2023
This version includes the following new and updated functions:
atr2(length)
An alternate ATR function to the `ta.atr()` built-in, which allows a "series float" `length` argument.
Parameters:
length (float) : (series int/float) Length for the smoothing parameter calculation.
Returns: (float) The ATR value.
changePercent(newValue, oldValue)
Calculates the percentage difference between two distinct values.
Parameters:
newValue (float) : (series int/float) The current value.
oldValue (float) : (series int/float) The previous value.
Returns: (float) The percentage change from the `oldValue` to the `newValue`.
donchian(length)
Calculates the values of a Donchian Channel using `high` and `low` over a given `length`.
Parameters:
length (int) : (series int) Number of bars (length).
Returns: ( [float, float, float ]) A tuple containing the channel high, low, and median, respectively.
highestSince(cond, source)
Tracks the highest value of a series since the last occurrence of a condition.
Parameters:
cond (bool) : (series bool) A condition which, when `true`, resets the tracking of the highest `source`.
source (float) : (series int/float) Series of values to process. Optional. The default is `high`.
Returns: (float) The highest `source` value since the last time the `cond` was `true`.
lowestSince(cond, source)
Tracks the lowest value of a series since the last occurrence of a condition.
Parameters:
cond (bool) : (series bool) A condition which, when `true`, resets the tracking of the lowest `source`.
source (float) : (series int/float) Series of values to process. Optional. The default is `low`.
Returns: (float) The lowest `source` value since the last time the `cond` was `true`.
relativeVolume(length, anchorTimeframe, isCumulative, adjustRealtime)
Calculates the volume since the last change in the time value from the `anchorTimeframe`, the historical average volume using bars from past periods that have the same relative time offset as the current bar from the start of its period, and the ratio of these volumes. The volume values are cumulative by default, but can be adjusted to non-accumulated with the `isCumulative` parameter.
Parameters:
length (simple int) : (simple int) The number of periods to use for the historical average calculation.
anchorTimeframe (simple string) : (simple string) The anchor timeframe used in the calculation. Optional. Default is "D".
isCumulative (simple bool) : (simple bool) If `true`, the volume values will be accumulated since the start of the last `anchorTimeframe`. If `false`, values will be used without accumulation. Optional. The default is `true`.
adjustRealtime (simple bool) : (simple bool) If `true`, estimates the cumulative value on unclosed bars based on the data since the last `anchor` condition. Optional. The default is `false`.
Returns: ( [float, float, float ]) A tuple of three float values. The first element is the current volume. The second is the average of volumes at equivalent time offsets from past anchors over the specified number of periods. The third is the ratio of the current volume to the historical average volume.
rma2(source, length)
An alternate RMA function to the `ta.rma()` built-in, which allows a "series float" `length` argument.
Parameters:
source (float) : (series int/float) Series of values to process.
length (float) : (series int/float) Length for the smoothing parameter calculation.
Returns: (float) The rolling moving average of the `source`.
supertrend2(factor, atrLength, wicks)
An alternate SuperTrend function to `supertrend()`, which allows a "series float" `atrLength` argument.
Parameters:
factor (float) : (series int/float) Multiplier for the ATR value.
atrLength (float) : (series int/float) Length for the ATR smoothing parameter calculation.
wicks (simple bool) : (simple bool) Condition to determine whether to take candle wicks into account when reversing trend, or to use the close price. Optional. Default is `false`.
Returns: ( [float, int ]) A tuple of the superTrend value and trend direction.
vStop(source, atrLength, atrFactor)
Calculates an ATR-based stop value that trails behind the `source`. Can serve as a possible stop-loss guide and trend identifier.
Parameters:
source (float) : (series int/float) Series of values that the stop trails behind.
atrLength (simple int) : (simple int) Length for the ATR smoothing parameter calculation.
atrFactor (float) : (series int/float) The multiplier of the ATR value. Affects the maximum distance between the stop and the `source` value. A value of 1 means the maximum distance is 100% of the ATR value. Optional. The default is 1.
Returns: ( [float, bool ]) A tuple of the volatility stop value and the trend direction as a "bool".
vStop2(source, atrLength, atrFactor)
An alternate Volatility Stop function to `vStop()`, which allows a "series float" `atrLength` argument.
Parameters:
source (float) : (series int/float) Series of values that the stop trails behind.
atrLength (float) : (series int/float) Length for the ATR smoothing parameter calculation.
atrFactor (float) : (series int/float) The multiplier of the ATR value. Affects the maximum distance between the stop and the `source` value. A value of 1 means the maximum distance is 100% of the ATR value. Optional. The default is 1.
Returns: ( [float, bool ]) A tuple of the volatility stop value and the trend direction as a "bool".
Removed Functions:
allTimeHigh(src)
Tracks the highest value of `src` from the first historical bar to the current bar.
allTimeLow(src)
Tracks the lowest value of `src` from the first historical bar to the current bar.
trima2(src, length)
An alternate Triangular Moving Average (TRIMA) function to `trima()`, which allows a
"series int" length argument.

Alma Moving Average Ribbon Reverse Length [DM]Greetings Colleagues
Following some recommendations and ideas I share this moving average, put all of them together
The length calculation is automatic there is only one input.
The length is inverse so it will wrap from the longest reference point, hence using phi
Moving averages will wrap around the price.
I've also added gradient color to plots and fill plots
There is an alert selector in case you are interested in a particular crossing, "remember that the order is reversed".
There is an alert visual plotshapes with offset signal.
Finally, after spending a few hours with the Williams alligator moving averages I found nothing special, but I added the individual offset adjustment for each moving average in case someone comes up with something.
Enjoy”
Some references about alma by "tradingview pinecoders"
What to look for
The Arnaud Legoux Moving Average has three elements to it:
Window: This element is the period. By default, the window is set to 9 periods, but it can be customized to fit any trading style.
Offset: This element is the Gaussian that is applied to the combo line and can be aligned to the current price. It’s default is set to 0.85, but by setting it to 1, you can make it align fully to the current price (similar to how an Exponential Moving Average (EMA) with a setting of 0 is like a Simple Moving Average (SMA)). 0.85 is what is recommended, however, you can customize it like with the window element.
Sigma: This element is a standard deviation that is applied to the combo line in order for it to appear more sharp. The default is set to 6 and it is not recommended to change the setting. The value of 6 is inspired by the Six Sigma process.
www.tradingview.com
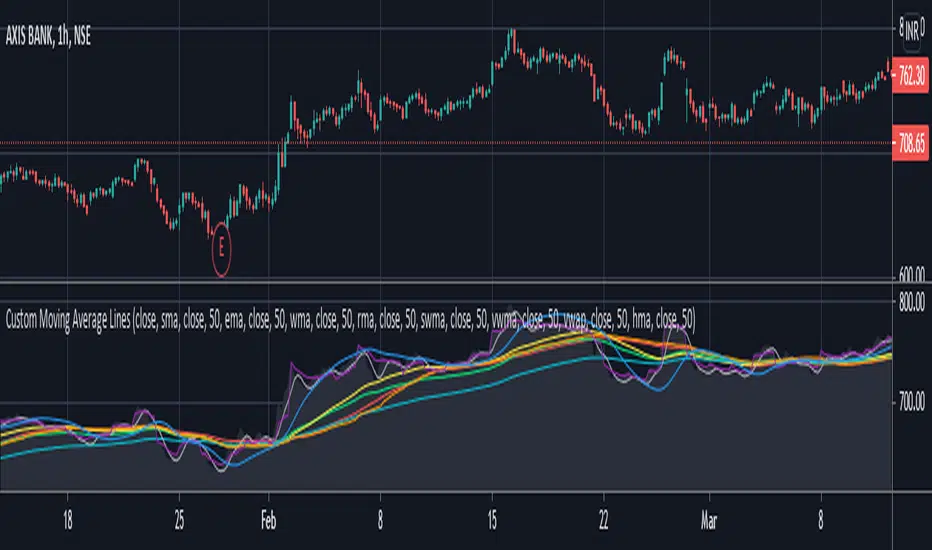
Custom Moving Average LinesHeylo!
This is a script for basic market trend analysis using moving average lines. It features eight lines with eight choices of moving averages and adjustable sources & time periods . The choice of moving averages are stated below:
1. Simple Moving Average (sma)
2. Exponential Moving Average (ema)
3. Weighted Moving Average (wma)
4. Relative Moving Average (rma)
5. Hull Moving Average (hma)
6. Sine-Weighted Moving Average (swma)
7. Volume Weighted Moving Average (vwma)
8. Volume Weighted Average Price (vwap)
Planning on including other formula based indicators soon. Let me know if there can be some improvements made / errors so I can fix it.
Cheers!
Auto Fibonacci ComboA combination of Fibonacci indicators including:
1- Moving Auto-calculated Fibo Retracement Levels
2- Dynamic Auto-calculated Fibo Extension Levels
3- Adjustable Auto-calculated Fibo Time Zones
4- ّFlexible Fibo Moving Averages Ribbon
The ribbon consists of 10 moving averages of selected source for different Fibonacci numbers count of bars which could be colorized for a better trend observation. Also the type of the moving averages could be picked up from 6 different types which are:
- SMA (Simple Moving Average)
- EMA (Exponential Moving Average)
- HMA (Hull Moving Average)
- LSMA (Least Squares Moving Average)
- TMA (Triangular Moving Average)
- MAEMA (My Personalized Momentum Adjusted EMA)
I think the latter one makes a nice conjunction with Fibonacci retracements.
Feel free to test the set and send me your thoughts.

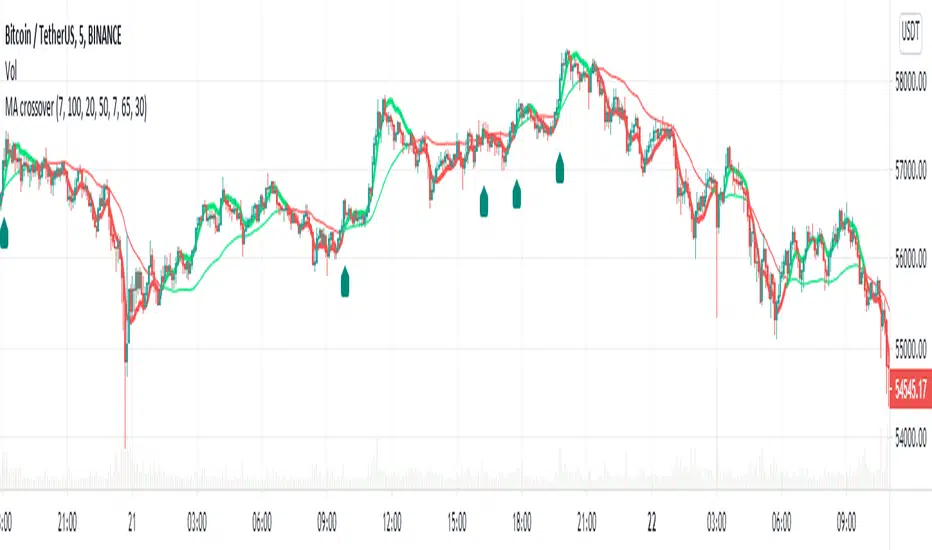
MA Crossover Alerts for Small Quick Profits on 3commas/DCA botDear fellow 3commas users,
This is a the most basic Moving Average crossover technique generating Buy Alerts.
This is especially written for those of you who want to link this basic crossover strategy with your 3commas DCA bot .
Buy Alerts
Moving averages available:
- Simple Moving Average (SMA)
- Exponential Moving Average (EMA)
- Weighted Moving Average (WMA)
- Hull Moving Average (HullMA)
- Volume Weighted Moving Average (VMWA)
- Running Moving Average (RMA)
- Triple Exponential Moving Average (TEMA)
Recommended settings for using with 3commas DCA bot:
Interval:
3m to 15m
3commas bot setup:
- TP/TTP: 0.3%/0.1%,
- Base Order: Your choice ,
- Safety Order: 1.2 * Base order
- Safety Order Volume Scale: 1.2,
- Safety Order Step Scale: 1.5,
- Max Active Deals: Your choice ,
- Price Deviation to Open Safety Order (% from initial order): 0.2%,
- Max Safety Trades Count: 7,
- Simulatenous Deals per Same Pair: 3
> Create Alert with Buy Alert and link it to your bot "Message for deal start signal"
Percentage Distance From Moving AverageThis indicator shows the percentage that an asset price is above or below its 50-period simple moving average.
You can change the 50-period moving average to whatever you'd like in the settings of the indicator.
There are other versions of this indicator that are currently public, but they all use the exponential moving average instead of the simple moving average.

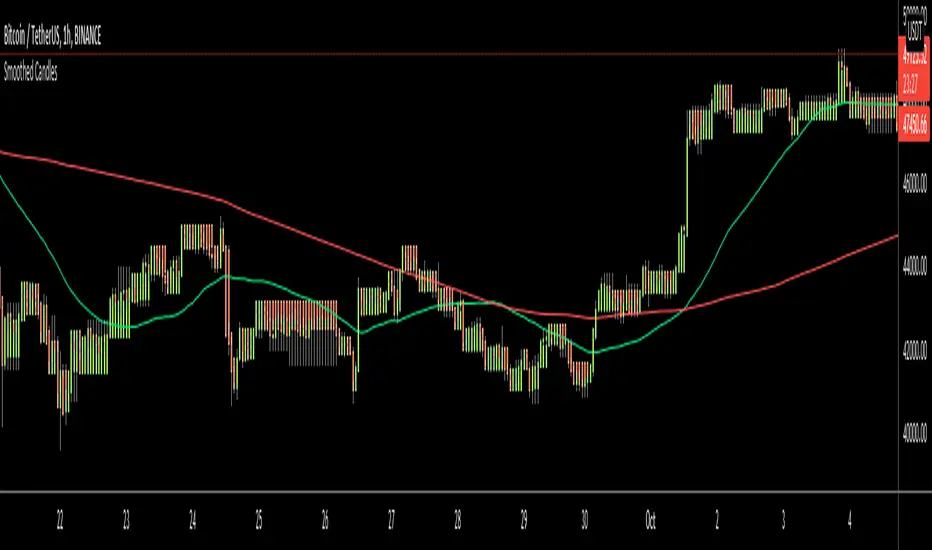
Smoothed CandlesHello Traders,
This is " Smoothed Candles " script to get rid of noises and to get a smoothed chart to figure out breakouts and price movements easily.
There are three scaling methods: User Defined, Dynamic (ATR) and Percentage
Optionally you can add 2 Simple Moving Averages and 2 Exponential Moving Averages
Optionally you can hide the Wicks, example:
You can add moving averages:
Easily find breakouts:
Enjoy!
MA-KIRILDIM-SANAThis is a lower block indicator. It helps us to follow the moving average crosses in the lower section in a single indicator without adding any moving averages in the main window.
When MA1 breaks MA2 up, the background color turns green or otherwise, the background becomes red. If you want, you can follow the lines of moving averages in here.
Three averages can be used in the system.
- SMA(Simple Moving Average)
- EMA(Exponential Moving Average)
- WMA(Weighted Moving Average)
Thanks

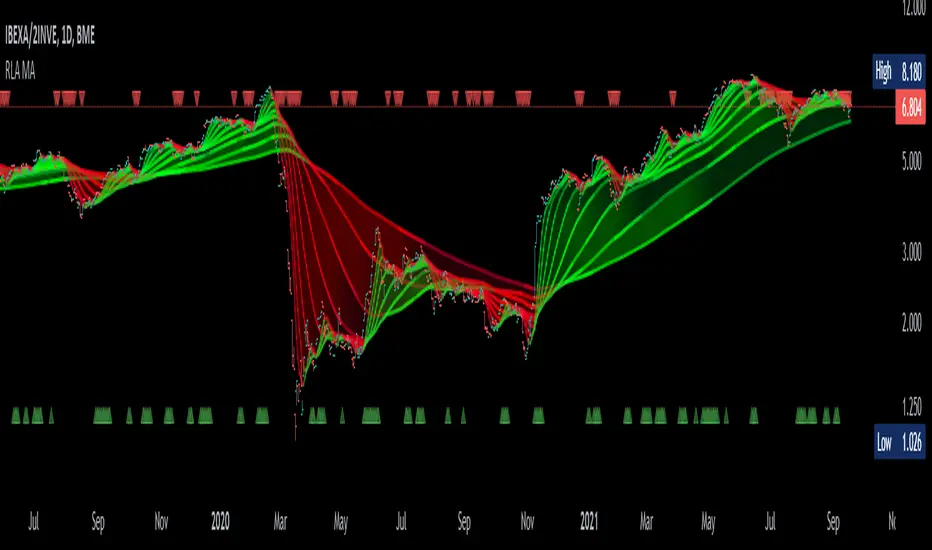
Logarithmic Moving AverageLogarithmically weighted moving average.
Here is how weight is distributed in LMA and RMA (exponential moving average)
As you know, logarithm of 1 is 0... This means the last bar in specified period will be ignored, and the log curve above applies to LMA of 9 bars.
So one bar should be added to the length when calculating the weight.
Result is faster than simple moving average, but a bit slower than linearly weighted moving average.

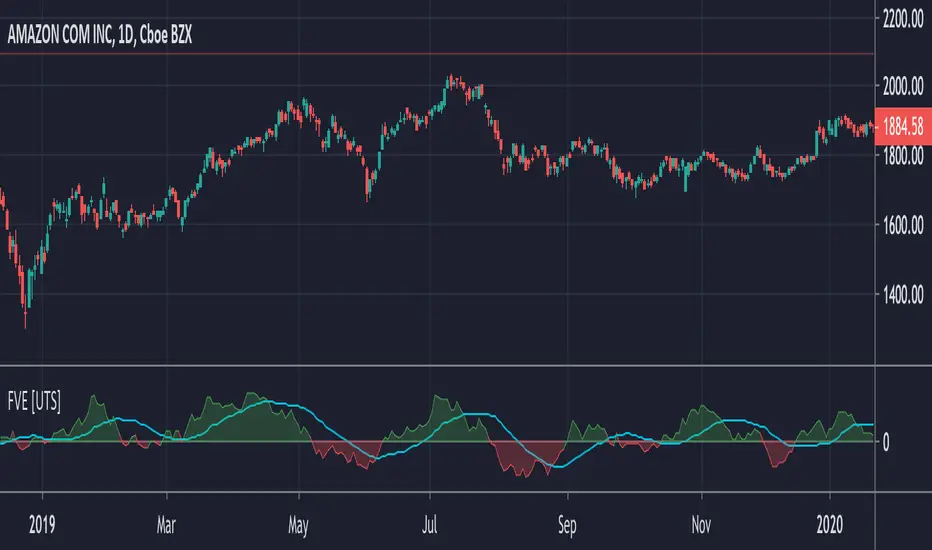
FVE - Finite Volume Elements [UTS]FVE is a money flow indicator but with two important differences from existing money flow indicators:
It resolves contradictions between intraday money flow indicators (such as Chaikin’s money flow) and interday money flow indicators (like On Balance Volume) by taking into account both intra- and interday price action.
Unlike other money flow indicators which add or subtract all volume even if the security closed just 1 cent higher than the previous close, FVE uses a volatility threshold to take into account minimal price changes.
General Usage
The FVE provides 3 types of signals:
The strongest signal is divergence between price and the indicator. Divergence can provide leading signals of breakouts or warnings of impending corrections. The classic method for detecting divergence is for FVE to make lower highs while price makes higher highs (negative divergence). An alternative method is to draw the linear regression line on both charts, and compare the slopes. A logical buy signal would be for FVE, diverging from price, to rise sharply and make a series higher highs and/or higher lows.
The most obvious and coincident signal is the slope of the FVE line. An upward slope indicates that the bulls are in control and the opposite for downward.
This is a unique and very important property of this indicator. Values above zero are bullish and indicate accumulation while values below zero indicate distribution. FVE crossing the zero line indicates that the short to intermediate balance of power is changing from the bulls to the bears or vice versa. The best scenario is when a stock is in the process of building a base, and FVE diverges from price and rises to cross the zero line from below, at a sharp angle. Conversely the crossing of the zero line from above is a bearish signal to liquidate positions or initiate a short trade.
Trend Visualisation
Optional: If the trend direction is DOWN the moving average is painted red. If the trend direction is UP the moving average is painted in green.
If the movement is FLAT then the color is grey.
Moving Averages
Five different types of Moving Averages are available for both FVE and the optional moving average of the FVE.
ALMA (Arnaud Legoux Moving Average)
Average Value
EMA (Exponential Moving Average)
SMA (Simple Moving Average)
WMA (Weighted Moving Average)
Calculation Methods
Since Markos Katsanos presented the first version of the FVE in April 2003.
Since then there have been various adaptions and improvements on this indicator.
The following are choosable for calculating the FVE:
Thinkscript usethinkscript.com
Linnsoft www.linnsoft.com
Volatility Adapted traders.com
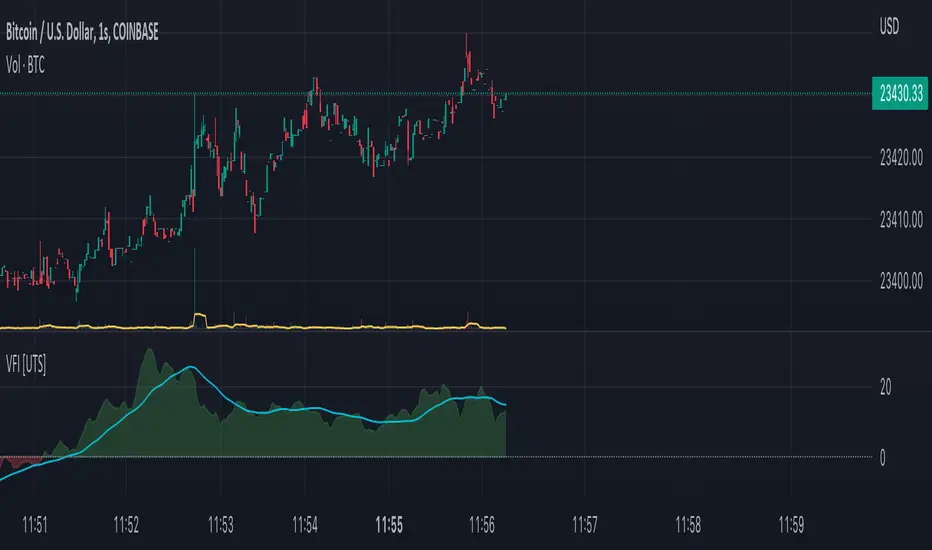
VFI - Volume Flow Indicator [UTS]The Volume Flow Indicator (VFI) indicator was first introduced in my June 2004 and is is based on the popular On Balance Volume (OBV) but with three very important modifications:
Unlike the OBV, indicator values are no longer meaningless. Positive readings are bullish and negative bearish.
The calculation is based on the day's median instead of the closing price.
A volatility threshold takes into account minimal price changes and another threshold eliminates excessive volume.
The indicator takes into account only the latest 6 month volume action and not the entire data loaded in the chart.
General Usage
A simplified interpretation of the VFI is that values above zero indicate a bullish state and the crossing of the zero line is the trigger or buy signal.
The strongest signal with all money flow indicators is of course divergence.
The classic form of divergence is when the indicator refuses to follow the price action and makes lower highs while price makes higher highs (negative divergence). If price reaches a new low but the indicator fails to do so, then price probably traveled lower than it should have. In this instance, you have positive divergence.
Default settings
130 VFI Length
0.2 Coef
2.5 Volume cutoff
3 Smoothing Period
Further setting examples can be found on www.precisiontradingsystems.com
Trend Visualisation
Optional Setting:
If the trend direction is DOWN the moving average is painted red. If the trend direction is UP the moving average is painted in green.
If the movement is FLAT then the color is grey.
Moving Averages
4 different types of Moving Averages are available for both FVI and the optional Moving Average of the FVI.
ALMA (Arnaud Legoux Moving Average)
EMA (Exponential Moving Average)
SMA (Simple Moving Average)
WMA (Weighted Moving Average)
Notes
This indicator is using the exact formula from mkatsanos.com where EMA has been taken as default value for FVI smoothing calculation.
Modified MACDThis is a modified version of the MACD (Moving Average Convergence/Divergence) oscillator. Instead of using exponential moving averages this modified version make use of simple moving averages. The default periods for this modified version of MACD is 3/10/16. This modified version of the MACD oscillator is described in detailed in Appendix B in the book The Art and Science of Technical Analysis: Market Structure, Price Action and Trading Strategies by Adam Grimes.

Multi Moving Averages (EMA / SMA Toggle) ConfigurableMulti Moving Averages (EMA / SMA Toggle) is a lightweight and highly configurable indicator designed to plot up to three moving averages on your chart with a clean and minimalist input panel.
The indicator allows you to switch seamlessly between Exponential Moving Averages (EMA) and Simple Moving Averages (SMA) using a single toggle, while preserving the same lengths, sources, and visual settings. Each moving average can be independently shown or hidden and fully customized for color, line width, and plot style.
This tool is ideal for traders who rely on multiple moving averages for trend identification, dynamic support and resistance, pullback analysis, and crossover-based strategies, while keeping their charts uncluttered and easy to read.
Key Features
Plot up to three moving averages
Global EMA / SMA toggle
Individual show / hide control for each MA
Customizable length, source, color, width, and style
Minimalist input layout with low scrolling
Fully compatible with the Style panel
Whether you prefer fast-reacting EMAs or smoother SMAs, this indicator adapts instantly to your workflow without requiring multiple indicators or duplicate settings.

OI: Simple BandOI: Simple Band (Open Source)
OI: Simple Band is a very simple, open-source overlay that draws a two-line moving-average band and fills the space between them to highlight trend bias and momentum shifts at a glance.
What it plots
EMA (Exponential Moving Average) using the selected length
SMMA (Smoothed Moving Average) using the same length
A ribbon fill between the two:
Green when EMA > SMMA (bullish bias)
Red when EMA < SMMA (bearish bias)
Why use two different MAs with the same length?
Even with the same length, these two averages react differently:
EMA weights recent prices more heavily, so it responds faster to changes.
SMMA is designed to be steadier and slower, filtering more noise.
Using the same length keeps the comparison fair (same smoothing window) while still giving you a “fast vs slow response” relationship. The distance and relationship between them becomes a simple way to see:
Momentum / pressure: When EMA pulls away from SMMA, price is moving with enough force to overcome smoothing.
Compression: When they converge, momentum is fading and conditions often look more “balanced.”
State changes: Crossovers flip the ribbon colour and can be used as a context shift (trend/bias filter), not a standalone entry/exit rule.
Inputs
Moving average band (length): Controls both EMA and SMMA smoothing.
SMMA Source: Chooses the data used for the SMMA calculation (EMA is calculated on close).
Notes
This is intentionally minimal: no higher-timeframe requests, no security() calls, no signals — just a clean visual band.
Like all moving averages, it updates on the live candle and will settle on bar close.

WoAlgo Premium v3.0
WoAlgo Premium v3.0 - Smart Money Analysis
Overview
** WoAlgo Premium v3.0 ** is an advanced technical analysis indicator designed for educational purposes. This tool combines Smart Money Concepts with multi-factor confluence analysis to help traders identify potential market opportunities across multiple timeframes.
The indicator integrates market structure analysis, order flow concepts, and technical momentum indicators into a comprehensive dashboard system. It is designed to assist traders in understanding institutional trading patterns and market dynamics through visual analysis tools.
### What It Does
This indicator provides:
**1. Smart Money Concepts Analysis**
- Market structure identification (Break of Structure and Change of Character patterns)
- Order block detection with volume confirmation
- Fair value gap recognition
- Liquidity zone mapping (equal highs and lows)
- Premium and discount zone calculations
**2. Multi-Factor Confluence Scoring**
The indicator calculates a proprietary confluence score (0-100) based on five key components:
- Price action analysis (30% weight)
- Volume confirmation (20% weight)
- Momentum indicators (25% weight)
- Trend strength measurement (15% weight)
- Money flow analysis (10% weight)
**3. Multi-Timeframe Analysis**
- Scans 5 different timeframes (5M, 15M, 1H, 4H, Daily)
- Calculates alignment percentage across timeframes
- Displays trend and structure status for each period
**4. Visual Dashboard System**
- Comprehensive main dashboard with 13 metrics
- Real-time screener table with 10 data columns
- Multi-timeframe scanner
- Performance tracking panel
### How It Works
**Market Structure Detection**
The indicator identifies key structural changes in price action:
- **BOS (Break of Structure)**: Indicates trend continuation when price breaks previous swing points
- **CHoCH (Change of Character)**: Signals potential trend reversal when market structure shifts
**Order Block Identification**
Order blocks are detected when:
- Significant volume appears at swing points
- Price shows strong directional movement from these levels
- Enhanced detection with extreme volume confirmation (OB++ markers)
**Fair Value Gap Recognition**
Gaps between candles are identified when:
- Price leaves inefficiencies in the market
- Three consecutive candles create a gap pattern
- Gap size exceeds minimum threshold based on ATR
**Confluence Calculation**
The system evaluates multiple technical factors:
1. **Price Position**: Relative to moving averages (EMA 20, 50, 200)
2. **Volume Analysis**: Standard deviation-based volume spikes
3. **Momentum**: RSI, MACD, Stochastic indicators
4. **Trend Strength**: ADX measurements
5. **Money Flow**: MFI indicator readings
Each factor contributes weighted points to create an overall confluence score that helps assess signal strength.
### Signal Types
**Confirmation Signals (▲ / ▼)**
Generated when:
- EMA crossovers occur (20/50 cross)
- Volume confirmation is present
- RSI is in appropriate zone
- Confluence score exceeds 50%
**Strong Signals (▲+ / ▼+)**
Higher-confidence signals requiring:
- Confluence score above 70%
- Extreme volume confirmation
- Alignment with 200 EMA trend
- MACD confirmation
- Bullish or bearish market structure
**Contrarian Signals (⚡)**
Reversal indicators appearing when:
- RSI reaches extreme levels (<30 or >70)
- Stochastic shows oversold/overbought conditions
- Price touches Bollinger Band extremes
- Potential divergence patterns emerge
**Reversal Zones**
Visual boxes highlighting areas where:
- Market structure conflicts with momentum
- High probability of directional change
- Key support/resistance levels interact
**Smart Trail**
Dynamic stop-loss indicator that:
- Adjusts based on ATR (Average True Range)
- Follows trend direction
- Updates automatically as price moves
- Provides risk management reference points
### Dashboard Components
**Main Dashboard (13 Metrics)**
1. **Confluence Score**: Current bull/bear percentage (0-100)
2. **Market Regime**: Trend classification (Strong Up/Down, Range, Squeeze)
3. **Signal Status**: Active buy/sell signal indication
4. **Structure State**: Current market structure (Bullish/Bearish/Neutral)
5. **Trend Strength**: ADX-based measurement
6. **RSI Level**: Momentum indicator with overbought/oversold zones
7. **MACD Direction**: Trend momentum confirmation
8. **Money Flow Index**: Smart money sentiment
9. **Volume Status**: Current volume relative to average
10. **Volatility Rating**: ATR percentage measurement
11. **ATR Value**: Average true range for position sizing
12. **MTF Alignment**: Multi-timeframe agreement percentage
**Screener Table (10 Columns)**
- Current symbol and timeframe
- Real-time price and percentage change
- Quality rating (star system)
- Active signal type
- Smart trail status
- Market structure state
- MACD direction
- Trend strength percentage
- Bollinger Band squeeze detection
**MTF Scanner (5 Timeframes)**
Displays for each timeframe:
- Trend direction indicator
- Market structure classification
- Visual confirmation with color coding
**Performance Metrics**
- Win rate percentage (simplified calculation)
- Total signals generated
- Current confluence score
- MTF alignment status
- Volatility level
### Settings and Customization
**Preset Styles**
Choose from predefined configurations:
- **Conservative**: Fewer, higher-quality signals
- **Moderate**: Balanced approach (recommended)
- **Aggressive**: More frequent signals
- **Scalper**: Short-term focused
- **Swing**: Longer-term oriented
- **Custom**: Full manual control
**Smart Money Concepts Controls**
- Toggle each feature independently
- Adjust swing length (3-50 periods)
- Enable/disable internal structure
- Control order block display
- Manage breaker block visibility
- Show/hide fair value gaps
- Display liquidity zones
- Premium/discount zone visualization
**Signal Configuration**
- Enable/disable confirmation signals
- Toggle strong signal markers
- Control contrarian signal display
- Show/hide reversal zones
- Smart trail activation
- Sensitivity adjustment (5-50)
**Visual Customization**
- Moving average display options
- MA period adjustments (Fast: 20, Slow: 50, Trend: 200)
- Support/resistance line toggle
- Dynamic S/R lookback period
- Candle coloring based on trend
- Color scheme customization
- Dashboard size options (Small/Normal/Large)
- Position placement (4 corners)
### How to Use
**Step 1: Initial Setup**
1. Add indicator to chart
2. Select appropriate preset or use Custom
3. Adjust timeframe to match trading style
4. Configure dashboard visibility preferences
**Step 2: Analysis Workflow**
1. Check MTF Scanner for timeframe alignment
2. Review Main Dashboard confluence score
3. Observe Market Regime classification
4. Identify active signals on chart
5. Confirm with Smart Money Concepts (order blocks, FVG, structure)
**Step 3: Trade Consideration**
Strong signals (▲+ / ▼+) require:
- Confluence score >70%
- MTF alignment >60%
- Confirmation from multiple dashboard metrics
- Support from Smart Money Concepts
- Appropriate volume levels
**Step 4: Risk Management**
- Use Smart Trail as dynamic stop-loss reference
- Consider ATR for position sizing
- Monitor volatility rating
- Respect support/resistance levels
- Combine with personal risk parameters
### Best Practices
**For Scalping (1M-5M timeframes)**
- Use Scalper preset
- Reduce swing length to 5-7
- Focus on strong signals only
- Monitor MTF alignment closely
- Quick entries near order blocks
**For Intraday Trading (15M-1H timeframes)**
- Use Moderate preset (recommended)
- Default swing length (10)
- Combine confirmation and strong signals
- Check MTF scanner before entry
- Use fair value gaps for entries
**For Swing Trading (4H-D timeframes)**
- Use Swing preset
- Increase swing length to 15-20
- Focus on strong signals
- Require high MTF alignment
- Patient approach with major structure levels
### Technical Specifications
**Indicators Used**
- Exponential Moving Averages (20, 50, 200)
- Hull Moving Average
- Relative Strength Index (14)
- MACD (12, 26, 9)
- Money Flow Index (14)
- Stochastic Oscillator (14, 3)
- ADX / DMI (14)
- Bollinger Bands (20, 2)
- ATR (14)
- Volume Analysis (SMA 20 with standard deviation)
**Calculation Methods**
- Swing detection using pivot high/low functions
- Volume confirmation via statistical analysis
- Multi-factor scoring with weighted components
- Dynamic support/resistance using highest/lowest functions
- Real-time MTF data via security() function
### Limitations and Considerations
**Important Notes**
1. This indicator is designed for educational and analytical purposes only
2. Historical performance does not guarantee future results
3. Signals should be confirmed with additional analysis
4. Market conditions vary and affect indicator performance
5. Not all signals will be profitable
6. Risk management is essential for all trading
**Known Limitations**
- Confluence scoring is algorithmic and not predictive
- MTF analysis requires sufficient historical data
- Effectiveness varies across different market conditions
- Sideways markets may produce conflicting signals
- High volatility can affect signal reliability
- Backtesting results shown are simplified calculations
**Not Suitable For**
- Automated trading without human oversight
- Sole basis for trading decisions
- Guaranteed profit expectations
- Inexperienced traders without proper education
- Trading without risk management plans
### Market Applicability
**Effective On**
- Trending markets (any direction)
- Clear structure formation periods
- Liquid instruments with consistent volume
- Multiple asset classes (forex, stocks, crypto, commodities)
- Various timeframes with appropriate settings
**Less Effective During**
- Extended ranging/choppy conditions
- Extremely low volume periods
- Major news events causing gaps
- Early market open with high spread
- Illiquid instruments with erratic price action
### Risk Disclaimer
**⚠️ IMPORTANT NOTICE**
This indicator is provided for **educational and informational purposes only**. It does not constitute financial advice, investment recommendations, or trading signals.
**Key Risk Factors:**
- Trading financial instruments involves substantial risk of loss
- Past performance does not indicate future results
- No indicator can predict market movements with certainty
- Users should conduct independent research and analysis
- Professional financial advice should be sought when appropriate
- Risk management and position sizing are critical to successful trading
- Users are solely responsible for their trading decisions
**Responsible Usage:**
- Combine with comprehensive market analysis
- Use appropriate stop-loss orders
- Never risk more than you can afford to lose
- Maintain realistic expectations
- Continue education on technical analysis principles
- Test thoroughly on demo accounts before live trading
- Understand all indicator features before using
### Educational Resources
**Understanding Smart Money Concepts**
Smart Money Concepts analyze how institutional traders and large market participants operate. Key principles include:
- Institutional order flow patterns
- Market structure changes
- Liquidity manipulation
- Supply and demand imbalances
- Order block formations
**Multi-Timeframe Analysis Theory**
Analyzing multiple timeframes helps:
- Identify overall market direction
- Improve entry timing
- Confirm trend strength
- Recognize consolidation periods
- Reduce conflicting signals
**Confluence Trading Approach**
Using multiple confirming factors:
- Increases signal reliability
- Reduces false signals
- Provides conviction for trades
- Helps with position sizing
- Improves risk-reward ratios
### Version History
**v3.0 (Current)**
- Multi-factor confluence scoring system
- Complete Smart Money Concepts implementation
- Real-time multi-timeframe analysis
- Four professional dashboard panels
- Enhanced order block detection
- Breaker block identification
- Premium/discount zone calculations
- Smart trail stop-loss system
- Customizable preset configurations
- Performance tracking metrics
**Development Philosophy**
This indicator was developed with focus on:
- Educational value for traders
- Transparent methodology
- Comprehensive feature set
- User-friendly interface
- Flexible customization options
### Technical Support
**For Questions About:**
- Indicator functionality
- Parameter optimization
- Signal interpretation
- Dashboard metrics
- Best practice recommendations
Please use TradingView's comment section below. The developer monitors comments and provides assistance to users learning to use the indicator effectively.
### Acknowledgments
This indicator implements concepts from:
- Smart Money Concepts trading methodology
- Multi-timeframe analysis techniques
- Technical indicator theory
- Market structure analysis principles
- Institutional order flow concepts
All implementations are original code and calculations based on established technical analysis principles.
---
## ADDITIONAL INFORMATION SECTION
**Category**: Indicators
**Type**: Market Structure / Multi-Timeframe Analysis
**Complexity**: Intermediate to Advanced
**Open Source**: Code visible for transparency and education
**Pine Script Version**: v6
**Chart Overlay**: Yes
**Maximum Objects**: 500 boxes, 500 lines, 500 labels
